

Picking up from other post on "What is Multivariate Data Analysis"...
A quick refresher:
Skewedness and Kurtosis
Skewedness is a measure of symmetry. The lower the number, the more symmetrical it is.
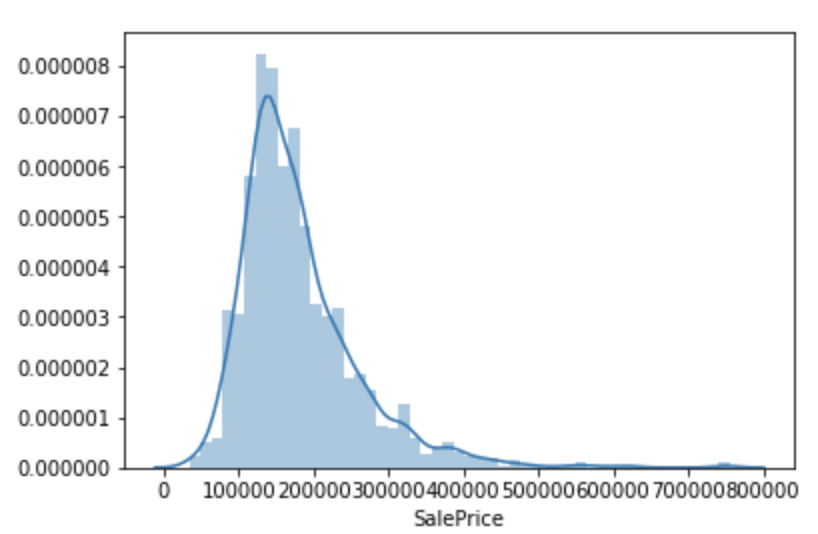
This little histogram has a Skewness = 1.882876
Kurtosis is a measure of whether the data has many or few outliers. The histogram above has a value of 6.536282.
df['COLUMN'].skew()
df['COLUMN'].kurt()
Standard Deviation
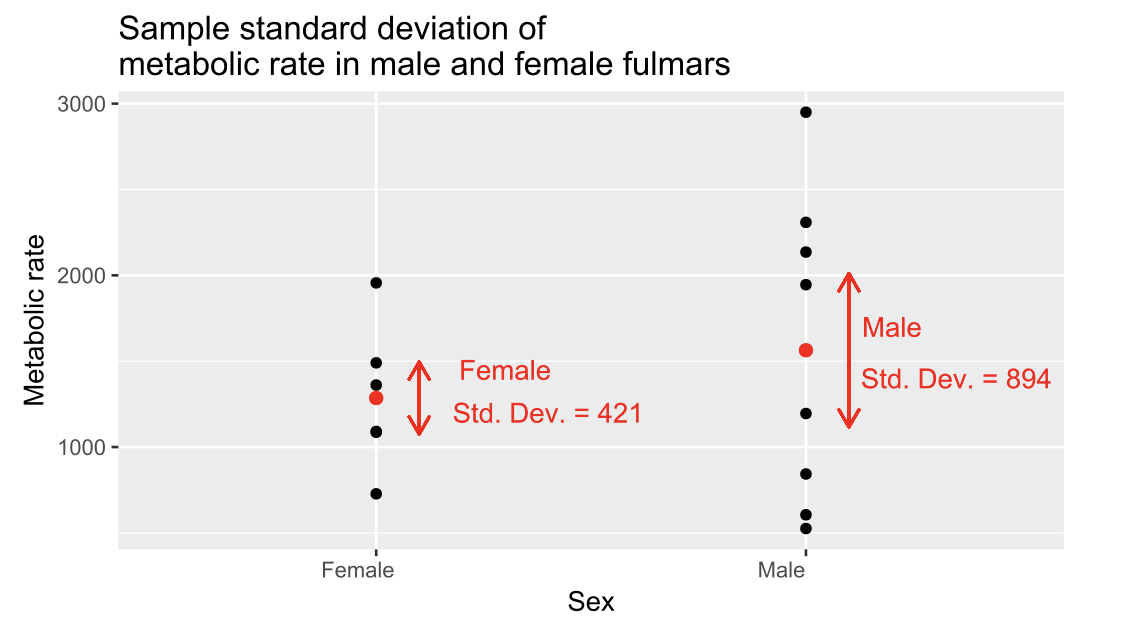
This measures the variation of a set of values.
I never use this...but maybe I should.
A low value indicates less variety. More values are near the average.
A higher number indicates more variety. Values are more disperse.
I like to think of it as a measure of the spread.
My Data Exploration process using Excel
Excel has a graphical UI. Python is code. In theory, the steps we use to approach data exploration should be similar. But there's a mental shift that needs to occur. Some of what is intuitive in Excel (at least with many years of practice) simply doesn't translate directly in Python.
Still, it should help to understand some of the steps I would traditionally take.
More to come...