

I'm a Product Manager Platform and Integrations team. I am responsible for enabling self-service, data-driven decision making for a group of nearly 1000 people . I was asked to present a series on "Why does data matter?" This blog post covers the first presentation.
It's almost silly question...but where do we start?
Let me start out by saying—this is a MASSIVE topic. And one that I personally find exciting. We’re living in a time where a lot of this stuff has been primarily in the hands of data scientists, data architects. People who are actually specializing in the field. The majority of articles you’ll find on the topics have titles like “data engineering and data science: bridging the gap” or “We’re all data scientists”. There are countless big data solutions and infinite big data problems. So it’s difficult to choose a direction.
But like all technology, progress in the field leads to standards. And we’re beginning to get a to a point where we can use these standards, learn from the mistakes of others, and make stronger, better, leaner decisions about what direction to take.
Leaders tend to worry and wonder. They feel like they're behind the trend, in terms of being a data-driven company. But really, we’re just getting to a point where a lot of the tools are starting to become standards. Custom-built solutions are being replaced by managed solutions with many of the cloud services like AWS, Google Cloud, and Azure.
You’ll be hearing more about things like “Democratizing data”.
So I truly believe the time is now.
There are a lot of data teams across the org here at [the company]. We have data analysts, data scientists, business analysts, and in general, just lots and lots of people who process, analyze, and consume data.
So what I want to talk about in this series of sessions, is part informational, part exercise/training, and part vision—starting small, but preparing for, looking for, the next big leap.
That’s sort of the magic of data—when it’s done right, it speaks for itself.
In this post, we'll cover:
1 - An Introduction
A little bit about myself, and some definitions.
2 - OKRs, KPIs
I can assume that we all have a fair amount of experience with this, so I won’t be going in to too much detail on these. But I do want to make sure we all have a clear understanding of why they’re essential to being a data-driven company. In a future session, we’ll be doing a workshop to build OKRs & KPIs that are relevant to your products.
2- Common barriers and solutions when trying to become data-driven
My ultimate goal here, is to get the business all to a place where we feel as badass as Netflix, Spotify…even Facebook (despite the breeches and public perception…which I’ll get in to a bit in a later session) feel about their data. I’m a little over 3 months in to this role, and I think I’ve gained a pretty solid appreciation for the complexity of our problem. So there’s a lot for the business to do before we can really compare ourselves with those data proud companies. I’ll be talking about what some of those problems are, and some of the ways other organizations have solved similar problems.
3 – The future, short and long term
Technology—what’s so different now than just two years ago? Our short-term future, Pendo. The mid-term future, data correlation across the org and deep insights. And I’ll touch a little bit about what other benefits this kind of data brings—namely in the world of machine learning. I intended to prepare Compliance Solutions for the future. I am NOT going to be talking about any specific frameworks, programming languages, tools or statistics. But for now, the prerequisite, the true problem to solve, is data.
Quick Introduction - Myself
I’m the product manager on the a Platform Integrations team here in our company's Innovation Center, in Pasadena CA. I've been with the company for 4 months. It’s my first time being a data product manager, and in general, it’s a bit of a newer role in the industry. And like many of the roles in technology, the definition can be open to interpretation.
In my role as a data product manager, today, one of my primary customers is other product managers. I’m here to help the people that are looking to understand their users. People who want to really build that empathy and connection, whose goal it is to build a better and more valuable product experience.
Therefore, as product manager, my role here, is to understand you, and empathize with you. And in the 4 months or so that I’ve been here, I believe I’ve gained an appreciation for the complexity of the problems we face.
To be more specific, I’m here to:
Enable behavior analytics for our product experiences. An effort to create a better product experience for customers. We have some of this today—but I think a lot of you in this room already know how difficult it is to actually gain any insights into these in our day-to-day. (I also want to prepare the business for the future...Artificial Intelligence, Machine Learning, Deep Learning...but that's a topic for another day.)
I've been a product manager in tech for a little over 5 years, and worked in various product/tech/operations/data related roles prior to that. I spent my earlier years as a data analyst--and that's never left me through the years. I love data, and I'm familiar with data problems.
That being said...there are a few core values that I strive for:
Guiding Principles
- Data should be accessible, easy to discover, and easy to process for everyone
- The simpler the visualization, the more effective it becomes.
- The longer you take to find the data, the less valuable it becomes.
- Measures are relative. You need reference points.
- Data privacy, data protection, and security are PARAMOUNT.
Definitions
Before we dive in, for the sake of clarity, let me start with a few definitions.
Data
"factual information (such as measurements or statistics) used as a basis for reasoning, discussion, or calculation" --Merriam-Webster
That's pretty close to being a useable definition for our sake...except for the word "factual". Data can be wrong. Data can be bad. Hence, data can be a major problem. But we'll get to that...the important thing to know is that data is information.
Data is measured, collected and reported, and analyzed. And it can be visualized using graphs, images or other analysis tools.
Insights
"the capacity to gain an accurate and deep intuitive understanding of a person or thing.”
Insights are NOT analytics. You can gain insight without analytics. Sometimes, insights are obvious. And you don’t necessarily need mounds of analytics and data to gain actionable insights.
But what about the intuition part? That's really the goal of data and insights.
Intuition
"the ability to understand something immediately, without the need for conscious reasoning."
Steve Jobs, Albert Einstein, and many visionaries regarded intution above all else. There are times, where you KNOW intuitively, that there’s something more to the data you’re looking at. Your body, your mind, store data. You learn. And your intuition is your non-verbal insight.
But there's a problem with this when it comes to business:
You cannot communicate "Intuition"
COMMUNICATION IS DIFFICULT.
How can we truly understand and empathize with our users? Beyond user interviews, since we understand that "everybody lies" (intentionally or not). And once we DO understand…When working with product designers, architects, developers.
How can we COMMUNICATE this understanding to the people that will actually be designing and building features, solutions, products? How can we make them understand the value of what they will be building?
Data is at the core of communication. Data is at the core of humanity. Data is not just in our DNA. Our own DNA—IS DATA. Made up of a code almost as simple as the binary zero’s and one’s processed by our computers.
You can do a much better, more accurate job of describing reality, by using data.
Topic 1: OKRs and KPIs
OKR = Objective and Key Result
It's a framework used by many notable companies such as Google. The primary goal of an OKR is organizational alignment. To get all of the teams and team members working toward the same overarching vision. Check out this blog post on OKRs for details about the history, how to write them, etc.
Some highlights:
- Objectives are memorable descriptions of what you want to achieve.
- Objectives should be short, inspirational and engaging.
- An Objective should motivate and challenge the team.
Examples:
- The Objective:
- Where do you need to go?
- Beat last quarter’s revenue growth
- Provide an awesome customer experience
- The Key Results:
- How will you know that you’re getting there?
- Close $1 million in sales
- Achieve an NPS score of 80
For our purposes today, the significance of the OKRs is their byproduct:
KPI = Key Performance Indicator
A KPI is a measurable value that demonstrates how effectively a company is achieving key business objectives. They work in tandem with OKRs. Some people may consider it semantics.
But for data, what we really want to get out of this is things that we can measure.
There should only be a few for any given product/feature/project/initiative. Hence the word "key".
Examples:
- The star-rating in the App Store ★★★☆☆
- Number of new features released
- Number of paid user conversions
- NPS Score
Once we have KPIs defined, we can actually start collecting data! More on that in a future session...
OKR and KPI Takeaways
- OKR’s help set the vision
- KPI’s help the business focus, and measure what matters
- You need OKRs to set and measure good KPIs
- They MUST be shared openly within the organization
We should have a clear set of KPIs to guide and communicate our decisions. They should be related to value, and the continuous delivery of it. They should change and evolve as our products change and evolve.
We need a clear set of KPIs to guide our decisions. Common measures in the past were related to the product delivery, like shipping on time, hitting certain revenue benchmarks. But today, it’s more about the value, and the continuous delivery of it. Therefore, our KPIs are bound to change and evolve. Our measures today should include how users adopt, use, engage with, and derive value from our products.
A Personal Anecdote...
I was part of a small and nimble technology team. The project I was working on was largely isolated from the rest of the parent organization.
The product we were working on was already reputable and profitable. But all of the apps were terrible. The iOS app had a 1.5 star rating in the App Store (that's a KPI!) and had not been updated in several years. Customer service was having a difficult time, our technical support for our customers was fantastic but horribly under-resourced and without the proper tools. And our technology team was on a frustrating technology stack with mounds of tech-debt.
My team and I was overworked, with a too-loosey-goosey agile framework and not enough developers or product managers to support it all. Leadership wasn’t asking the right questions, focused only what they felt was right, without the proper metrics available to them. We never did a good job of communicating our OKRs, our measures…had we done OKRs the way we were supposed to, EVERYBODY AT THE COMPANY would be able to see everything I saw. The crashlytics measures, the NPS scores, the App Store and Google Play store sentiment…ALL of that should have been available for the people within the org to look at and understand what we're working on. This is part of the OKR framework, and it has proven results.
Had I done one thing differently at my last job, that’s it. I wish I would have enabled the ability for anybody, data analysts, scientist, developers, business leaders, anybody interested, to find, create, edit and share KPI dashboards for everyone to see. We had the data. And we understood where we were actually successful.
Everybody who was personally involved with the project knew how difficult it was. But when corporate leadership came in to check in on how their new acquired company a few years too-late, the business was missing major marks.
We just didn’t stop to think about how worthwhile it may really be to share it. We were an awesome team with a lot of successes. Now, in hindsight, maybe actually committing to the OKR process could have saved a lot of headaches and heartbreak that came later. (Of course there were a lot of other factors involve...but for the sake of the story...)
Which leads me to...
KPI Dashboards - We need them. And we need to focus on the barriers, problems to solve, before we can get data and insights that are true to the core values I mentioned earlier.
Topic 2: Common barriers and solutions when trying to become data-driven
In this next section I want to talk about some of the biggest problems that many companies, encounter when trying to become data-driven. Cultural and leadership stuff aside, I’m going to be focusing on the technology problems and solutions, since they tend to be the loudest [perceived] detractors. Some notable common issues:
- Systems and security make the data too difficult to access
- Scattered solutions amongst various silos
- Heavy data sets, complex tools, new languages
- Lack of clarity over roles and responsibilities
- Bad data
I'll be talking about some of the ways other companies have been able to solve similar problems.
But first, some more definitions...
Must-Know Terms
These are the must-knows, from my perspective. There is far more technical detail out there...but this is intended for a somewhat-technical audience.
Database
You probably know this one.
Data Warehouse
A data warehouse stores processed data so that it's ready for decision makers to access.
The data comes from different places, such as internal applications, customer-facing apps, external partner systems, and others. This data is periodically pulled from those systems, and it goes often through several ETL (Extract-Transform-Load) tools. How frequently data pulls occur, or how data is formatted, etc., will vary depending on the needs of the organization.
A data warehouse may or may not use familiar database technologies. But it is different than a database in that it is not usually accessed by (or optimized for) an application. It is used for analytics.
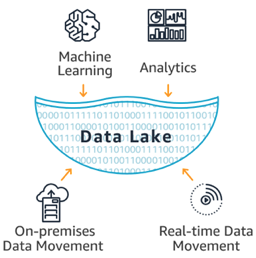
Data Lake
A data lake is a storage repository for EVERYTHING.
It stores unprocessed, raw, unstructured data. It's ideal for Machine Learning, because this is the kind of the data the humans actually see and use. Documents like PDFs, Word files, system and application logs...literally, everything. I like to use the Dropbox analogy--think of the Dropbox folder on your personal device. Imagine all your data being sync'd to Dropbox. That's the first part of a data lake.
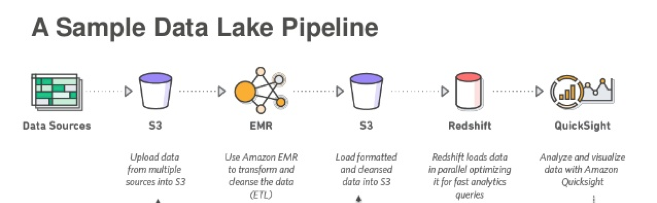
A data lake is more of a concept than a single system/solution. The two core parts are:
- Storage - such as AWS S3 and Google File Store. (These storage services can also be used for a ton of other stuff...like Serverless applications)
- Compute - this is data warehousing side. AWS Redshift and Google BigQuery are two common solutions.
Data Catalog
A data catalog is exactly what it sounds like! It enables users, from analysts, data scientists, and developers to discover and consume data sources. It's essentially a repository of metadata for data that allows for contributions and crowd-sourcing. Data catalogs are a newer concept, but becoming more and more necessary.
Democratize data! (For non-technical users)
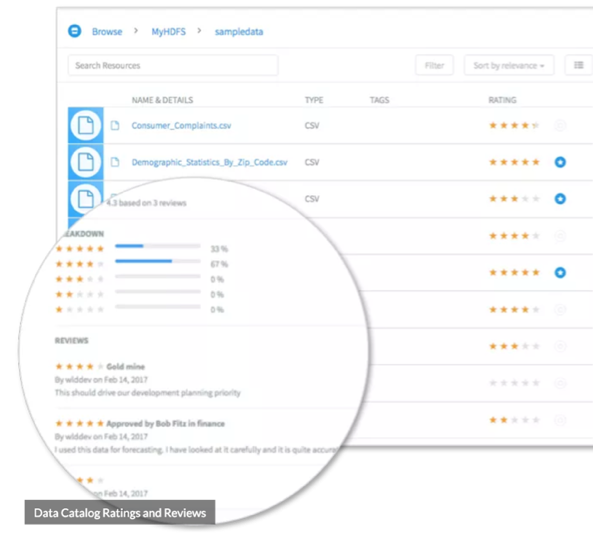
"A good data catalog serves as a searchable business glossary of data sources and common data definitions gathered from automated data discovery, classification, and cross-data source entity mapping. Data catalog administrators should be able to assign data source owners, subject matter experts, stewards and consumers using role-based policies. Governed, audited data catalog access is also needed." (Source)
And the last term for the day:
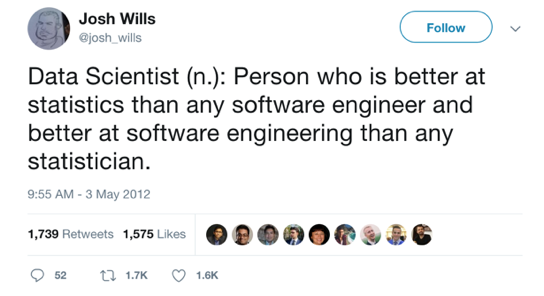
I include this...to really make this point clear: Don't bother a data scientist with basic questions, basic visualizations.
Self-service is absolutely necessary to avoid bugging the hell out of a proud data scientist.
Have you seen some of the work these people can produce? Data is beautiful. But we'll get to that...
Problem: Systems and security make the data too difficult to access
At the company I work for, security is best-in-class. This is a good thing for data protection. But it makes data insights incredibly difficult.
Bill.com's Story (Source)
Bill.com automates the way that small businesses pay their bills, send invoices, and get paid. Small businesses have a lot more complexity than a simple bill quickpay services.
They processes over 40 million documents a year that their customers upload into their system. These documents arrive unstructured, random, and in multiple formats…sound familiar?
Through machine learning, their software is becoming more and more like Dropbox than services like Chase Quickpay or Paypal. Processing, storing, and tracking the documents.
They’re managing over a million transactions a month their payments platform, and have over 60 billion dollar payment volume that flows through the platform. Because they’re dealing with highly sensitive data, and started out with only on-premise data, they were at a similar starting point as the business. And like the business, security is crucial here.
But they’ve been able to find success through modern cloud solutions—in this case with the help of AWS.

Regardless of whether or not they “migrate to the cloud”, their solution for data is cloud-based and successful.
Cloud-providers like AWS are eager to help organizations make these strategic moves.
Security is everything...and there are solutions.
Problem: Scattered solutions amongst data teams + Heavy data sets, unfamiliar tools
This is a common problem with technology—when it’s not there, users find their own way. Organizations such as the business, over the years, end up with dozens, even hundreds, of enterprise systems, platforms, dev teams, data teams, and solutions. Therefore, data ends up being in places we can't find. Teams own their data. And even if they're willing to share, it's often a burden, difficult to correlate, and difficult to find quick meaningful insights.
Heavy data sets...ever tried to work with an Excel spreadsheet that has close to a million rows, and dozens of calculated fields? It hurts. So naturally, this pain grows exponentially the more data that you product and consume.
Netflix on "A Series of Unfortunate Events" (Source)
Netflix has a LOT of data.
An average of over 700 billion events are written to their data ingestion pipeline every day—peaking at well over 1 trillion.
The data is processed and landed in their data warehouse, which was built completely with open sourced technologies. Back in October 2017, this database was over 60 petabytes in size, and growing at a rate of 300 terabytes a day.
The data is ACTIVELY used around the company—around 5 petabytes of reads.
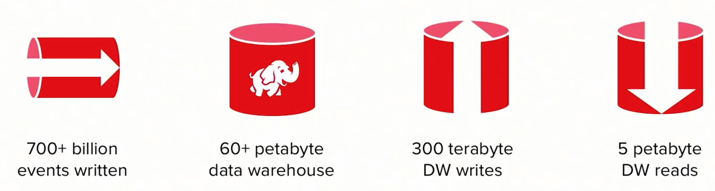
(We'll talk about the little elephant another day )
This is massive—but it’s more a result of them having built an environment that can really scale.
Event = the interactions a user takes across the service. Auth into an app, content received as recommendations, when a user clicks on content, plays, pauses, stops.
Data is written into their ingestion pipeline, which is backed by Kafka.
And lands in a raw ingestion layer inside of data warehouse (all in the cloud, all using AWS). Some of you may be familiar with S3 buckets. They’re wonderful.
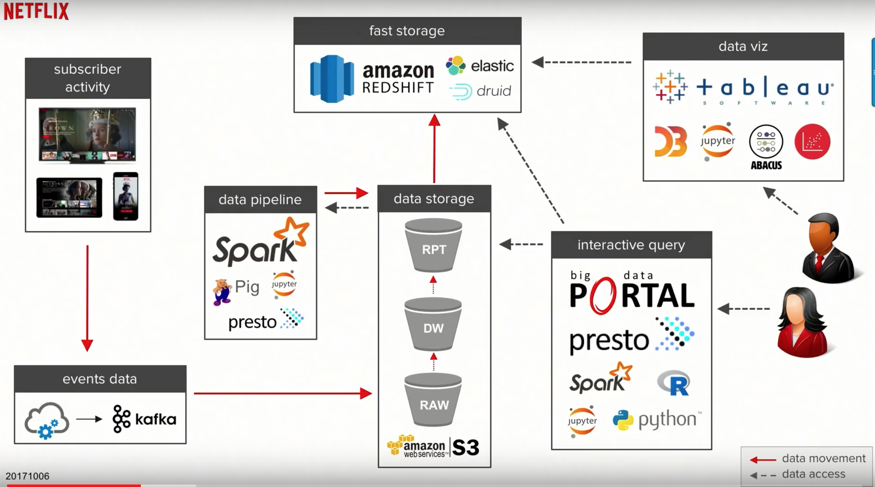
From the S3 buckets, they use some of the common big data processing technologies like Spark, and from there write back to S3.
A subset of this data is moved over to fast storage—an AWS Redshift solution. And from there, they can connect to it with their visualization and analysis tools such as Tableau, Jupyter, etc.
EVERY PERSON AT THE COMPANY HAS ACCESS TO THIS! To their "Big Data Portal".

This is the kind of environment that Netflix has created, to enable their decision makers to create products, actual movies and television shows, based on user data (House of Cards story).
Problem: Lack of clarity over roles and responsibilities
Roles and responsibilities can vary at any organization. But here's how Netflix has it laid out...
Netflix’s roles:
Data Engineer – a software engineer who specializes in data
Analytics Engineer – picks up where the software engineer leaves off. Might be doing aggregations, some visualizations, etc.
Data Viz Engineers – people who specialize in data visualization
Data consumers:
Business analysts – have deep vertical expertise
Research Scientists, quantitative analysts
Data Scientists, ML Scientists
Product Managers & Decision Makers
Problem: Bad Data
The people who need data, data consumers, are the ones who are affected by the bad data…but they don’t feel the impact of it right away.
There is oftentimes no way to know ahead of time to know whether the data is trustable. You get it wrong once, and it will forever be stuck in your head. You’ll never trust a data source again.
It’s not apparent until the data reaches the top layer. Executives who look at the data to make decisions about the company’s strategy. And Netflix, they pride themselves in actually using data for decisions rather than the old familiar trope: “I have an idea and just need the data to prove it”. Their content team, for example: What should we spend our money? Based on predictive models built by data scientists. “Here’s what we expect the audience to be for a title”. It supports niche audiences with small audiences—allowing that kind of focus. While also appealing to broader audiences. This doesn't work if the data is unreliable.
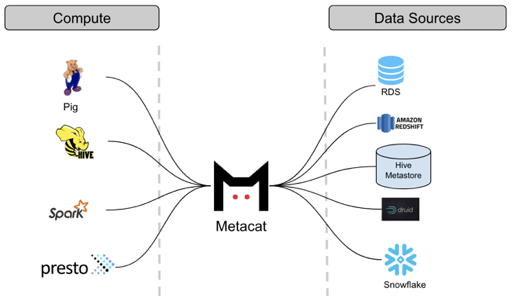
Netflix solves this problem in their solution design. Bad data is EXPECTED. Solutions are built to detect data quality issues. Traditionally, data issues are not discovered until months later. Of course, it’s better to try to detect these issues rather than discover them. Netflix created a tool called Metacat that has statistics about the data that was written in their big data solution. They use this with fancy math and statistics to detect problems during their ETL.
Netflix built a way to check for this before it becomes visible. All the bad stuff can still happen, but their systems check for the standard deviations, they purposely fail the ETL and don’t go any further in the process. They do the same for the reporting layer.
This means that the user doesn’t see ANY data. No data is better than bad data. It makes it clear that there’s a quality issue. It should be obvious that there’s a quality issue. Let everyone know! It’s not anybody’s fault. The goal is to NOT make decisions when you don’t have data, or have bad data. There are all sorts of architecture considerations, push vs pull, schedules, ETL jobs, aggregation jobs…but we can save that stuff for another day. In general, there will always be issues. But Netflix has built their solutions in such a way that the data consumers have confidence in the data that Netflix’s team produces.
Executives looked up data on how content was being used, made a decision, based upon the data, to start investing in Netflix Originals. A strategy decision based on the data they have. 80% of people watch content through recommendations--powered through data.
Key takeaways:
- EXPECT data issues
- DETECT data issues
- Fix data issues
- Delivering high quality analytics is REALLY difficult to do well. Even for Netflix.
From Within My Group: The Future, Near and Long-Term
I'm 4 months in to this role, and I still have a lot of people to meet. And there's a possibility I could be totally off-base with all of this. The scope is massive, and there are teams and solutions that I need to partner with and haven't met yet. But I feel there is a ton of opportunity here.
Near-Term
Pendo is a tool that helps product teams understand and guide users to create product experiences that customers love. We'll be able to use this data to better understand our users.
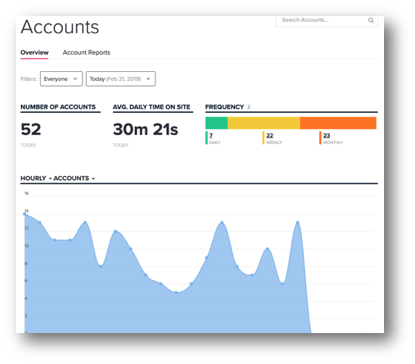
Out-of-the box, customizable/shareable dashboards:

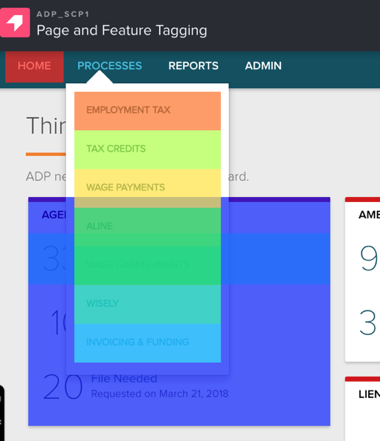
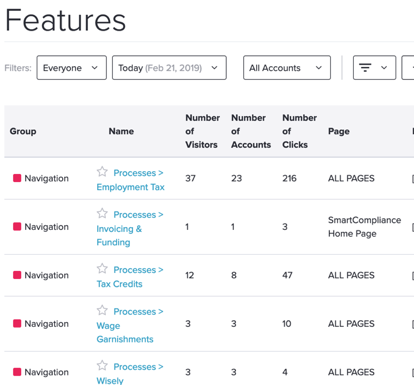
Visual heat-maps and feature-tagging:
User/Client-level behavior:

- Pendo + Data Layer variables
- Behavior Analytics, Segmentation, Deeper Insights
- KPI Dashboards
- Understand the broader user journey as they interact with various business client experiences across products / services / segments
- Additional trainings, knowledge-sharing
Long Term
- Data Democratization!
- Data correlation across all of business units for deeper insights
- How many days from briefcase time, to Salesforce, to actually using the product for the first time?
- What was the impact a new feature release had on service calls?
- Machine Learning/Deep Learning enablement…but data comes first.
Longer term...where I'd love to take this...
We can feasibly see a future where the bulk of the document processing is solved for with a convolutional neural network. Unstructured documents, like agency notices, can be read by the models. Even some of the best algorithms are not working with 100% accuracy—human interaction is necessary. But with a workforce like the business', we can use that human interaction to our advantage. Imagine a document processing pipeline where the initial processing is done by algorithm, corrections are made by a human, and those corrections are fed back into the to neural network better train the algorithm…this is COMPLETELY feasible today. And just one area of opportunity.
But, data comes first. And in that respect, we have a lot of work to do.
Data insights are the precursor to all of this. Those insights will allow the business to focus on the true problems to solve. Allowing the business to discover new audiences, build new solutions, and build better products.
Key Takeaways
This is HARD
This is POSSIBLE
We have a lot to learn, but will have a lot to learn and experiment with.
So, why is data important?
- Communication is DIFFICULT
- Data describes REALITY
- Data will help you test and prove/disprove your hypothesis
- Data will help you uncover NEW audiences, personas, segments
As product managers, our job is to write stories. Data tells the story.
A final note, regarding stories:
I believe that “As a blank, I want to blank, so that I can blank” should only be a template for some basic user stories. If you know how to tell a better story, do it.
Did you hear the story about the guy who hired professional writers to attach stories to eBay junk?
Stories create value.
And stories themselves are valuable.
That’s why data matters.