
I’ve been researching the use-cases and technical implementation for Graph Databases lately. As a Product Manager broadly responsible for the production and distribution of data insights, the appeal of building a Knowledge Graph is instant. I grew up watching the X-Files. My wife and I spend a lot of time watching Murder Mysteries, because we are fascinated by the discovery. The detective work. So for me, the thought of knowledge graph conjures up images like this one.
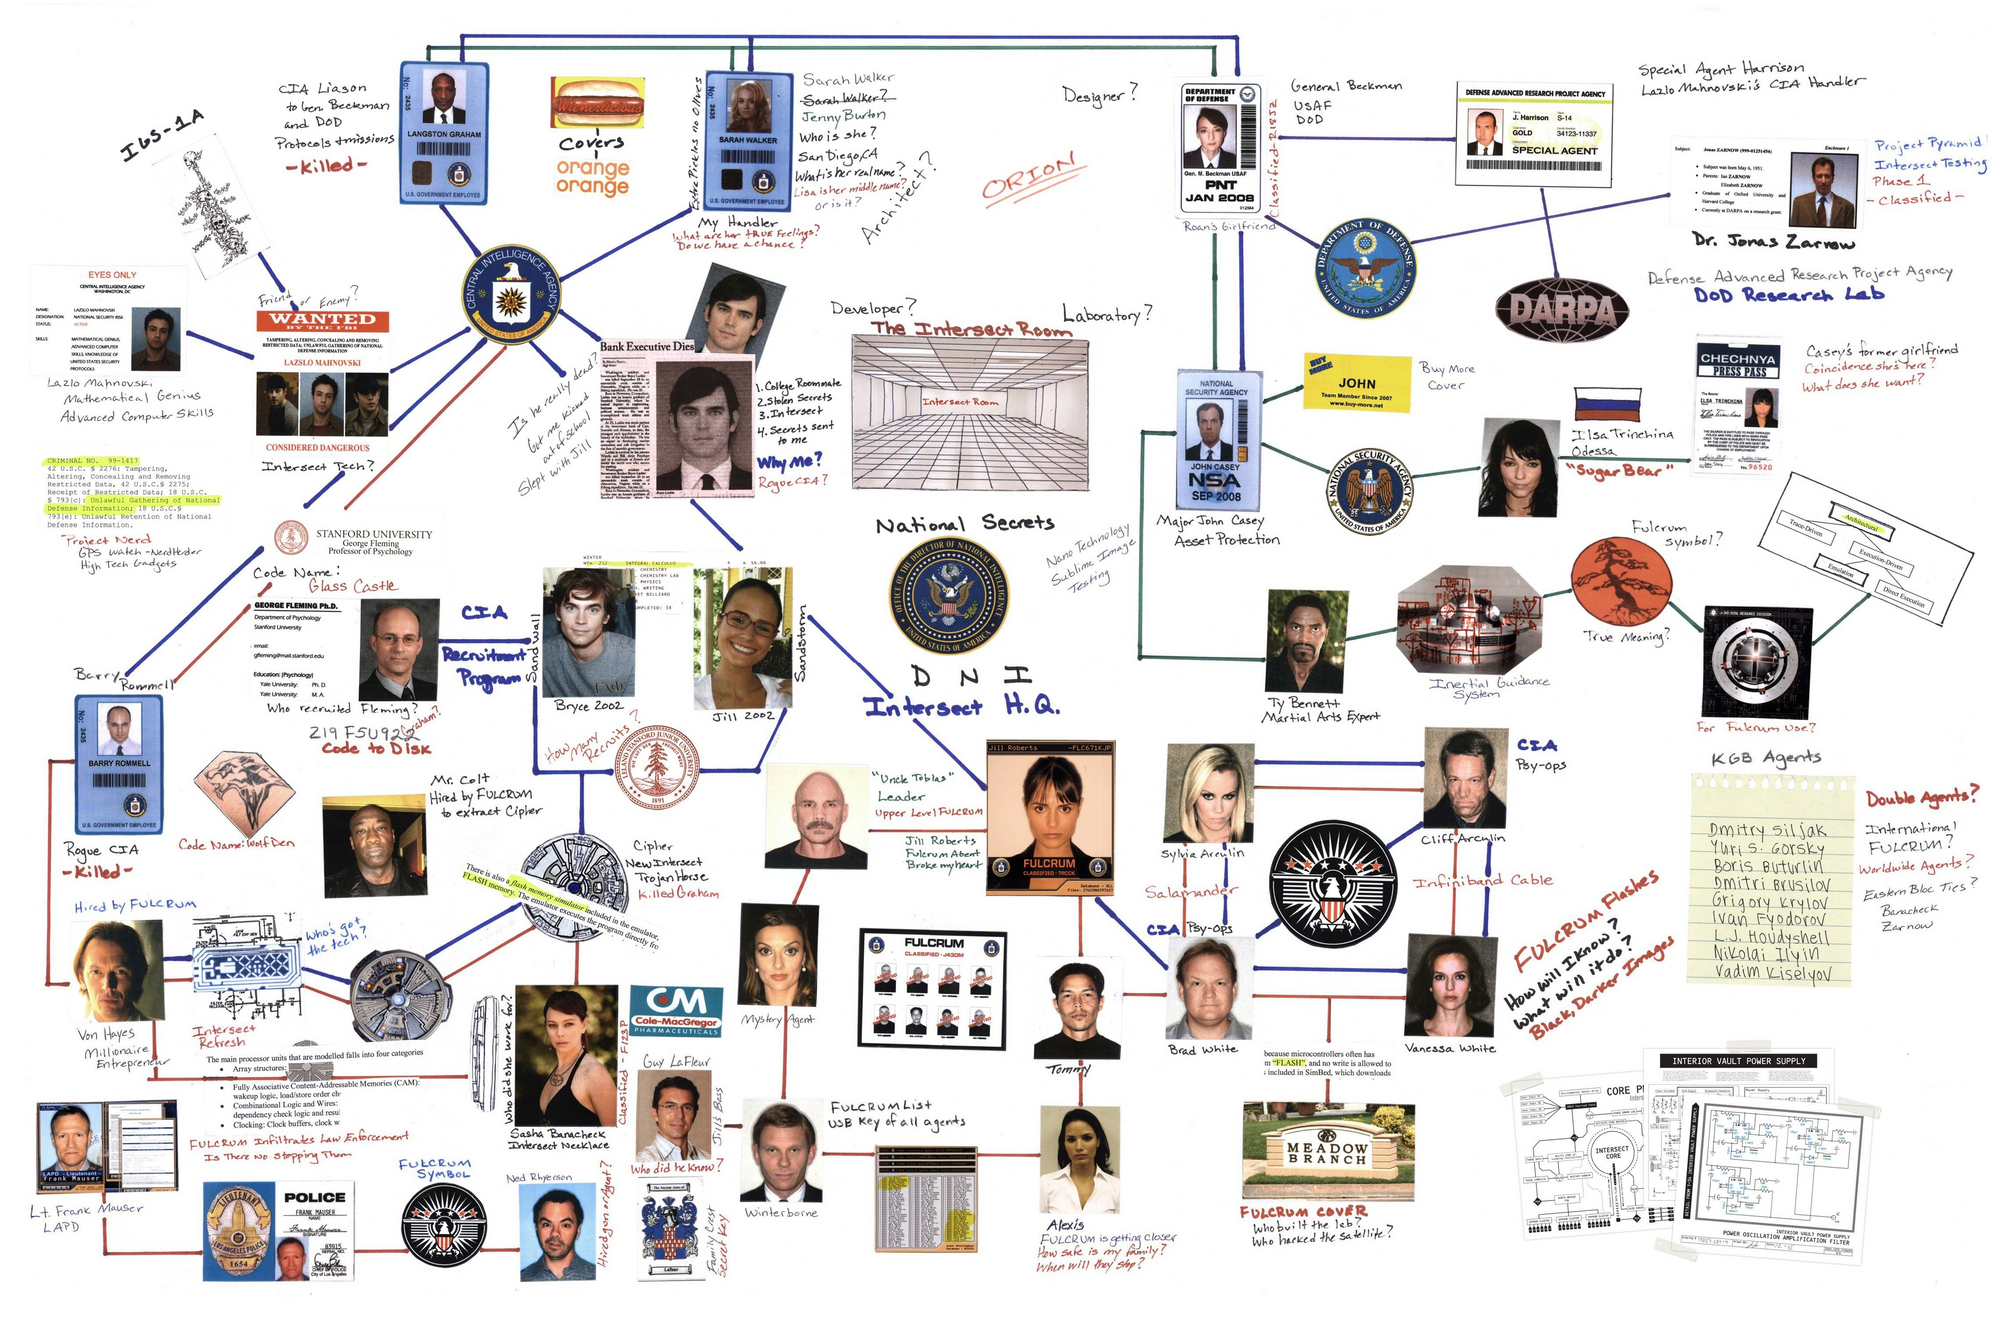
(Source: https://www.pinterest.com/pin/540994973986046134/?nic_v1=1aepv0ej06lbb4%2FgONeU%2Bu6r2RseVQhHUlIkqvVNTo0A%2FVc1MGbuHOM0yr2UJ3VnTm)
These are the tools that some detectives use when investigating crimes.
Graph databases are of similar efficiency.
They are the best method for representing “connected data”. Markus knows Prajeet’s cousin Sandy who plays the trumpet in a hardcore punk band that is managed by Markus’ 89 year old aunt Millie. Connected data.
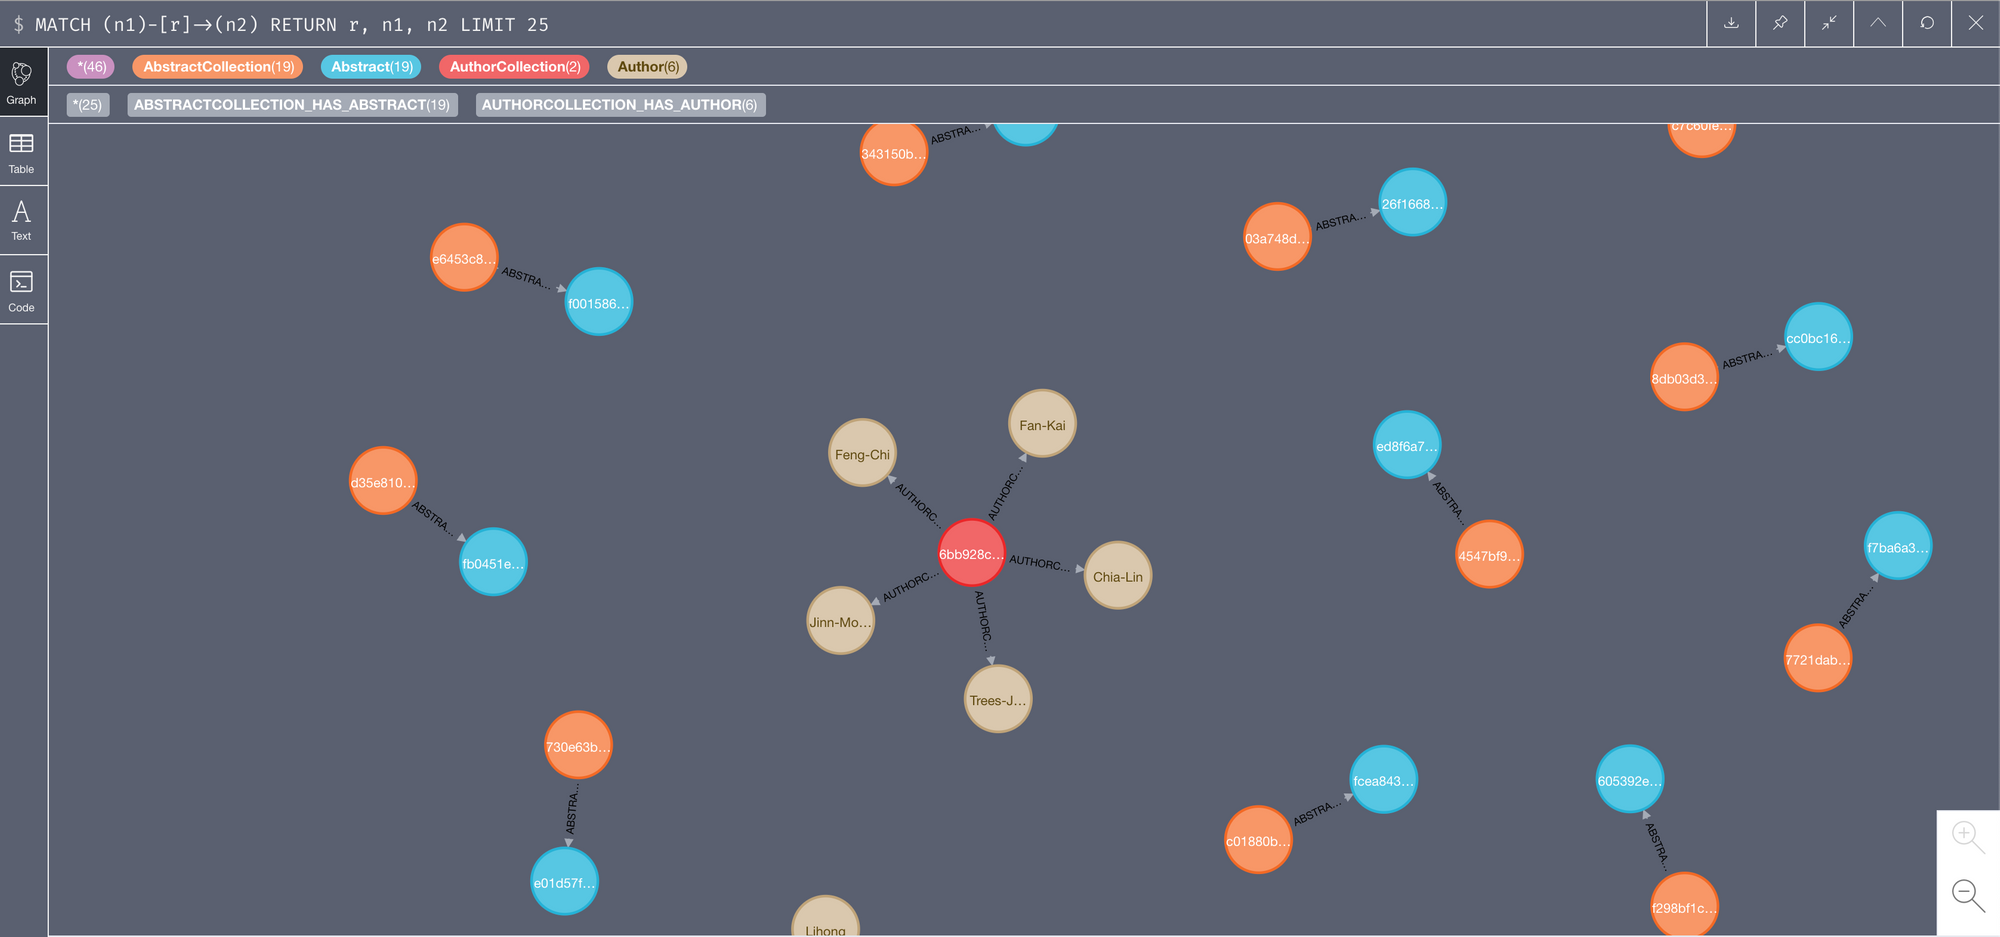
Let’s explore neo4j’s Data Graph for COVID-19.
“Neo4j is like a mashup of a REPL + lightweight IDE + graph visualization.”
I’ll leave out all the programming stuff for now.
A graph database can store any kind of data using a few simple concepts: 1. Nodes - graph data records 2. Relationships - connect nodes 3. Properties - named data values
I’m enjoying Neo4j’s casual onboarding so far.

(Hey! That looks a little like a node in a mongodb NoSQL database!)
