

I've been spending some time lately in the reporting and analysis of web application speed. Here's a few screenshots the PageSpeed Insights from my own website, for inspiration.
This was completely free, with under 20 minutes of configuration.
PageSpeed Insights for edfig.me

https://edfig.me gets an overall score of 89. I built this blog for easy-updates/content management. I haven't spent any time on site optimization--so I'm pretty happy with that for now.
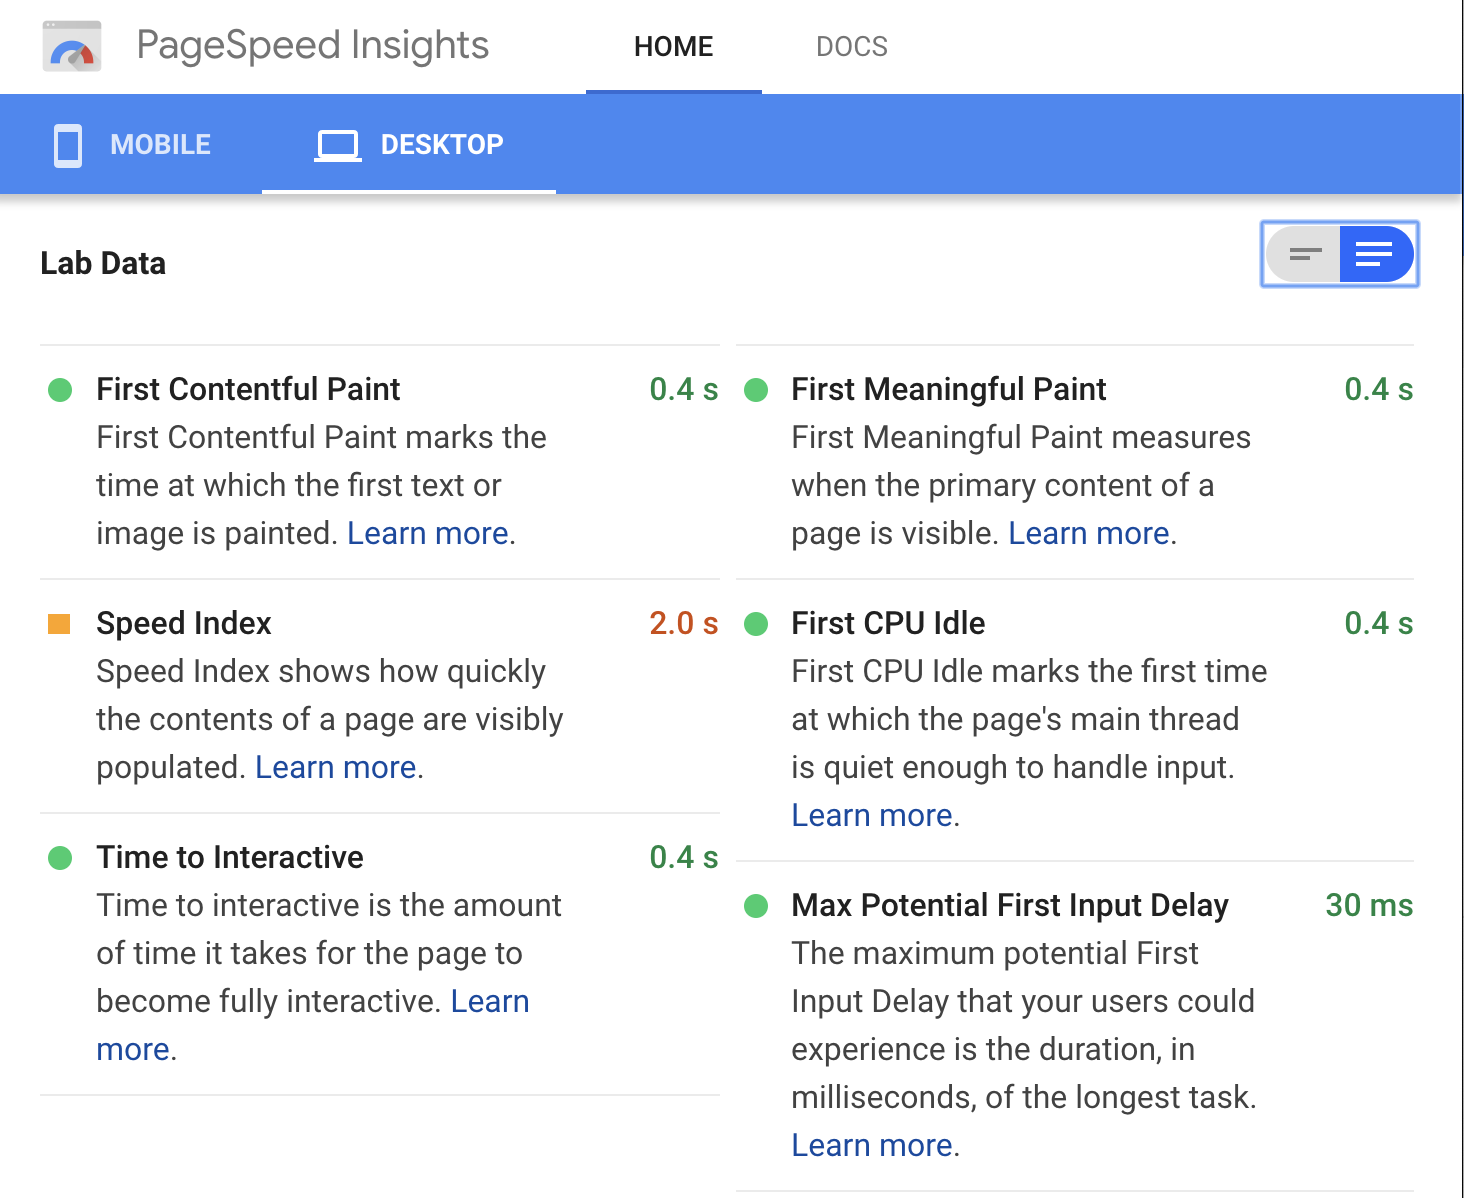
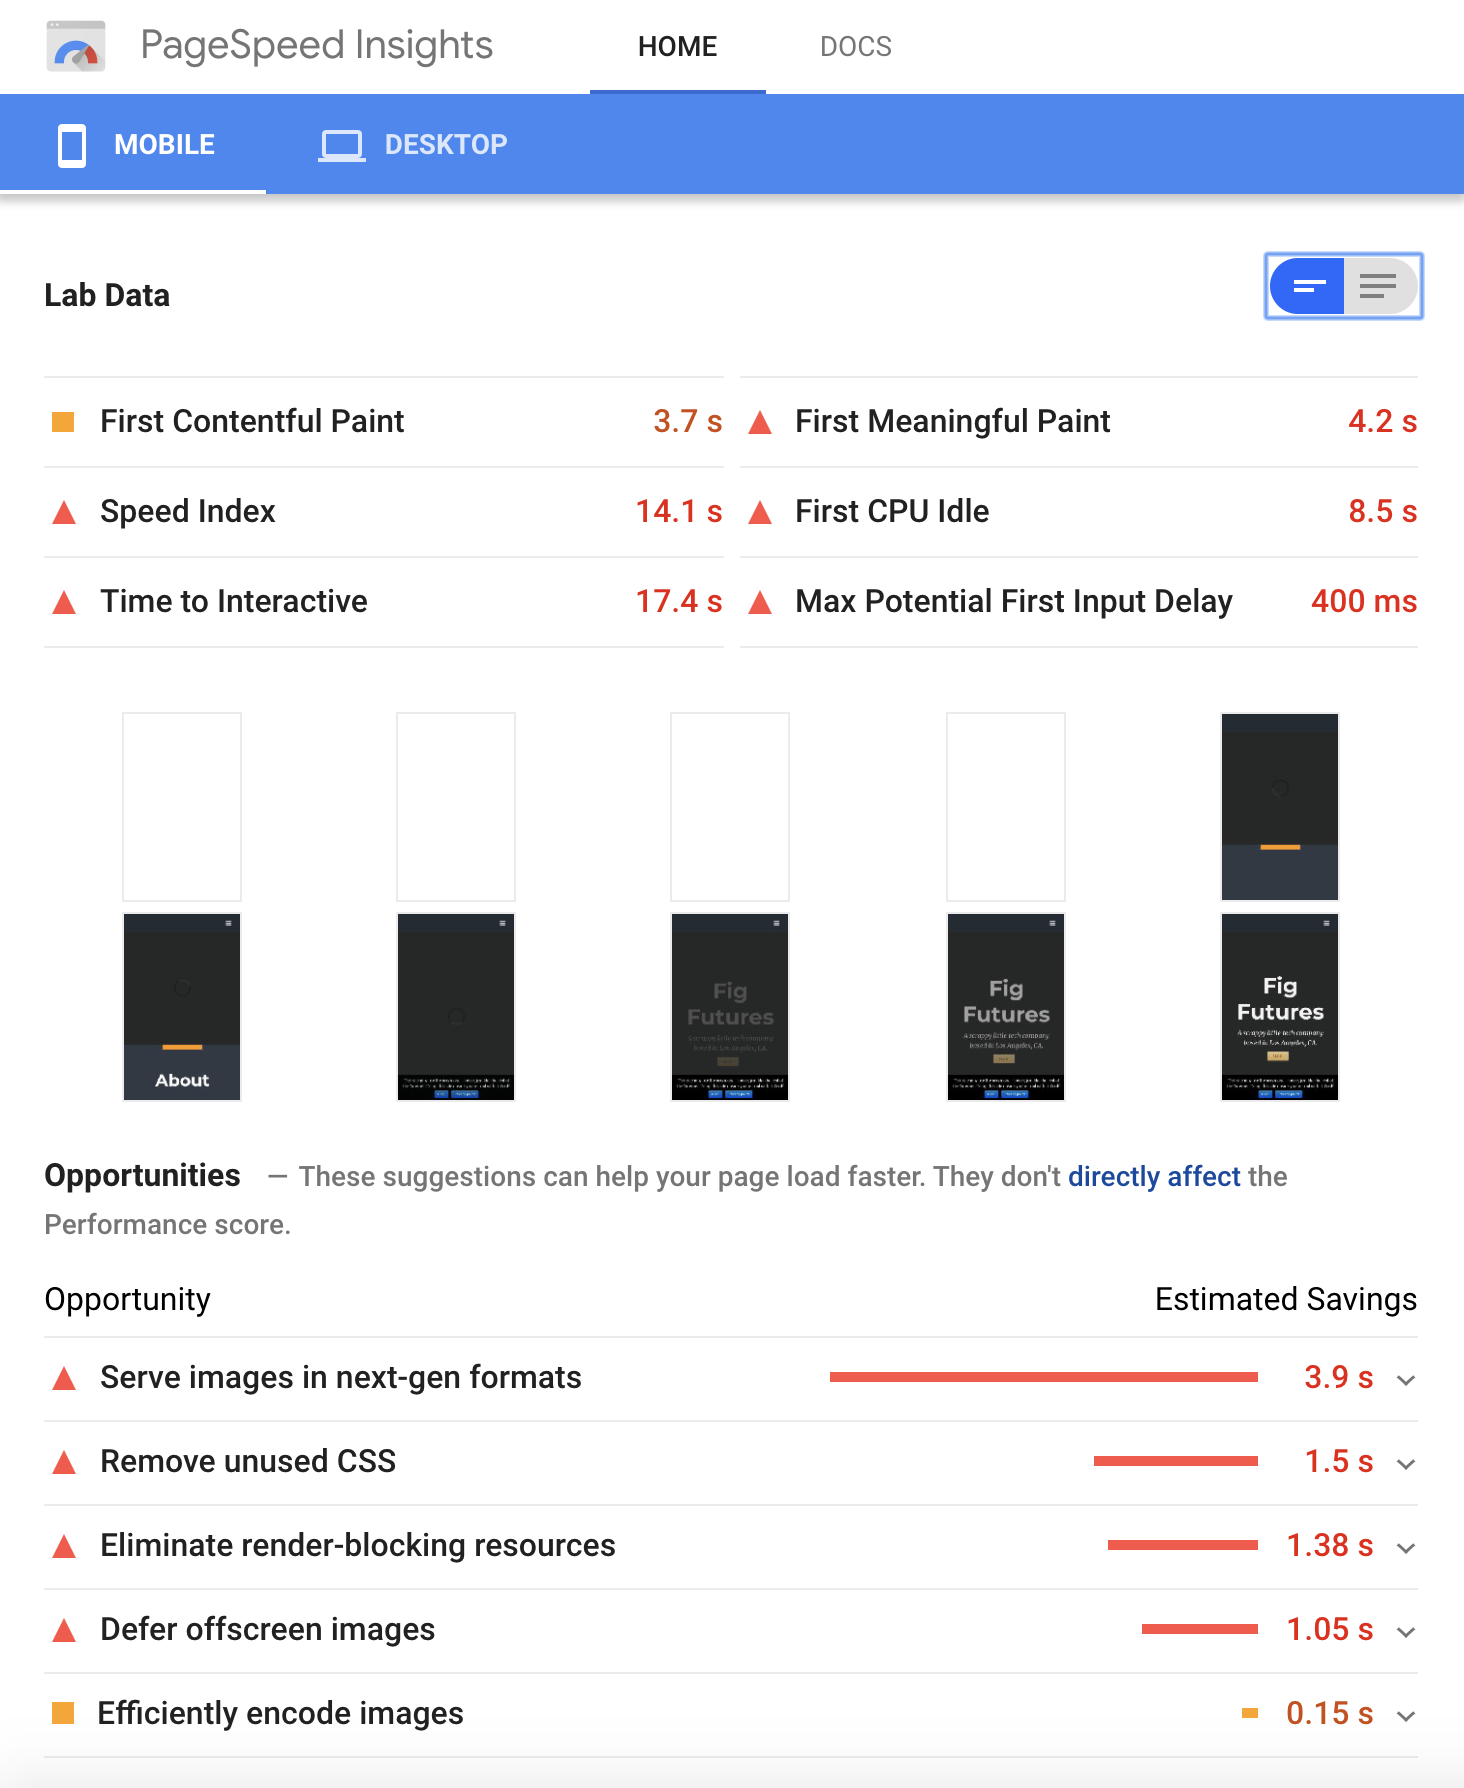
Lab Data Measurements
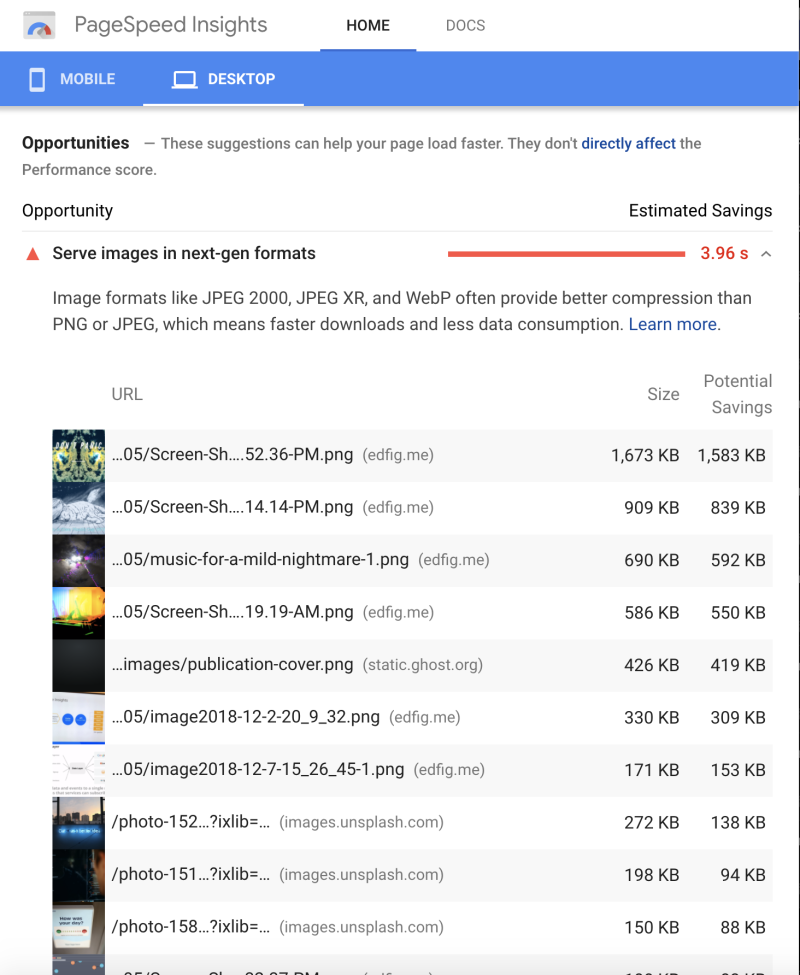
Opportunities
Serve Images in Next-Gen Format
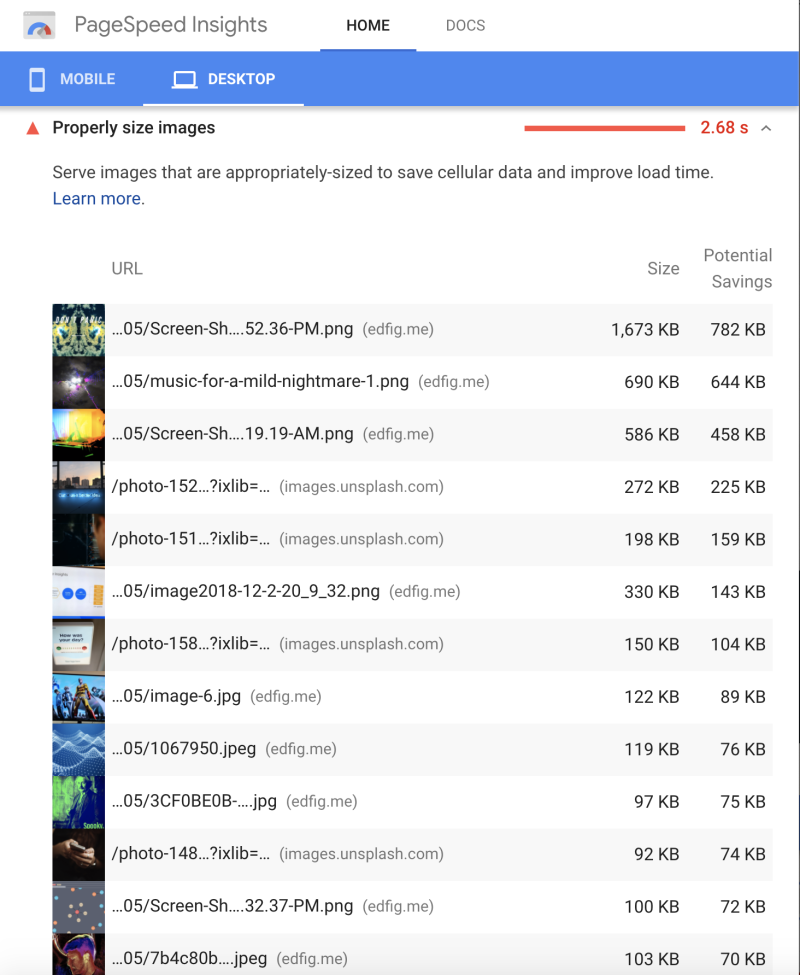
Properly Size Images
Diagnostics
Avoid enormous network payloads
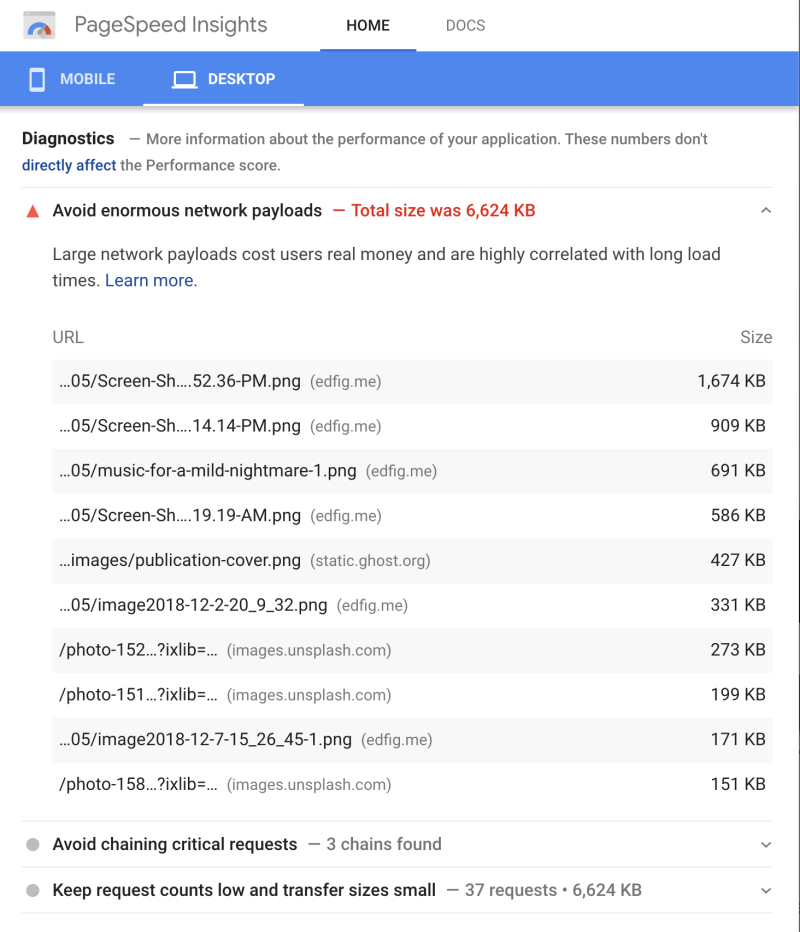
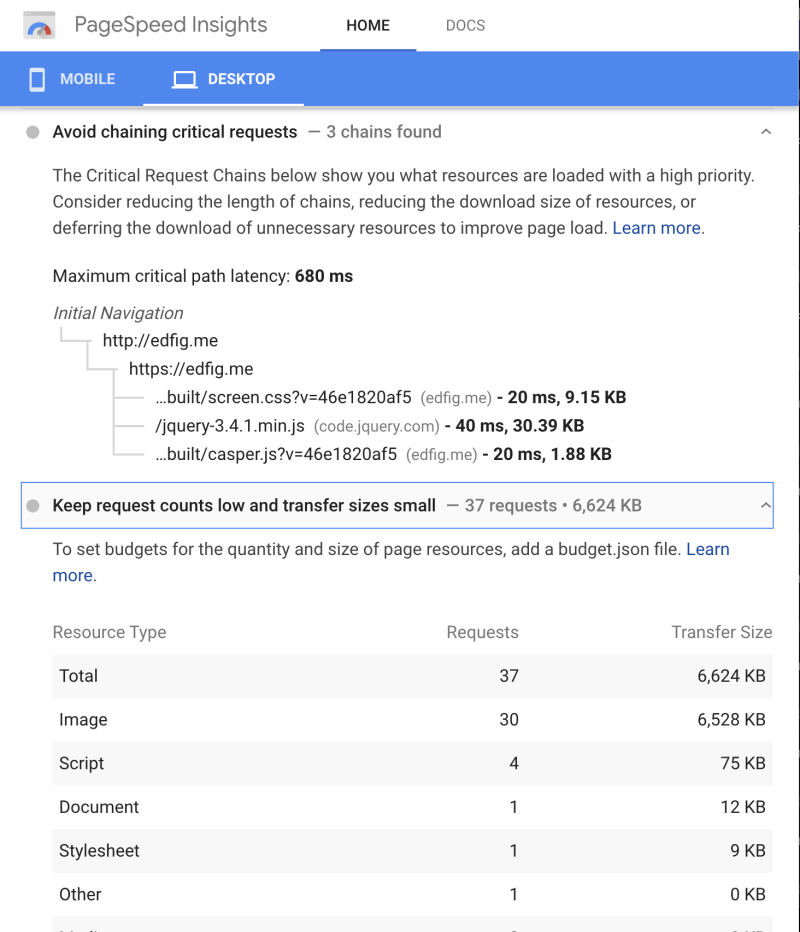
It tells you exactly which assets are the culprit. Neat!
Avoid chaining critical requests / keep request counts low and transfer sizes small
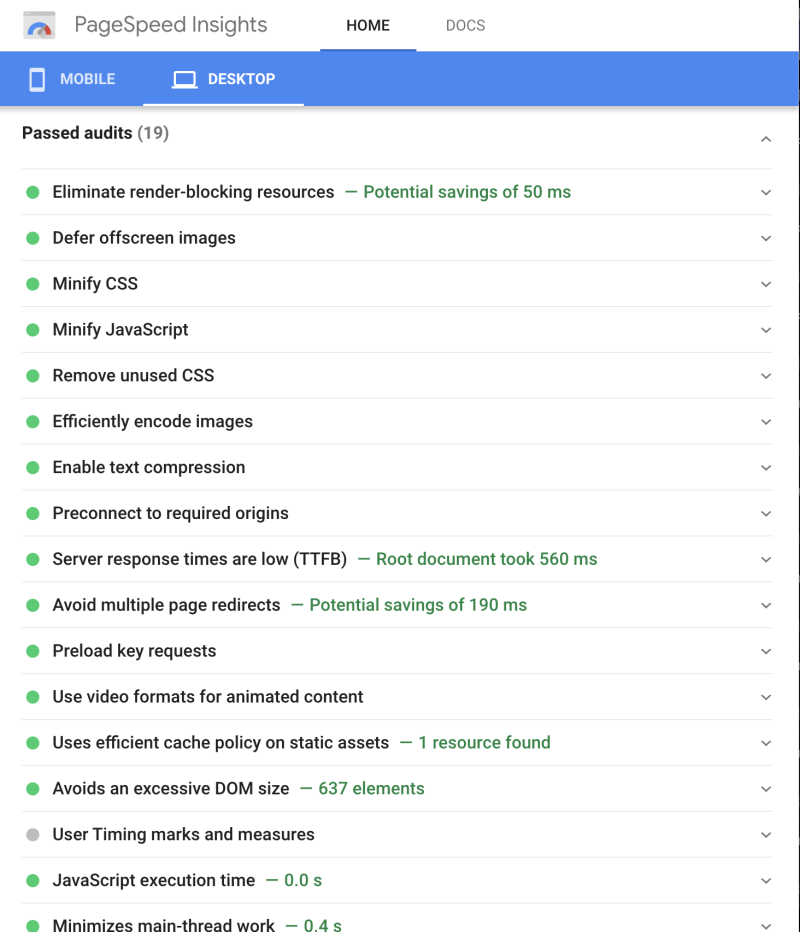
Other checks (incomplete list)
Lab data from my other older/slower website:
This entire diagnostic happens automatically! Impressive.
✌🏻